
Thermal Imaging Manfred Kihn
In my article “What Am I Looking At?” (August 2022), I reflected on the use of grayscale imagery with white-hot polarity (white—hot, black—cold, everything else—shades of gray) while using your thermal imager (TI). This month, I want to expand on this more by talking about colorization and temperature measurement.

All TIs will produce colorization. This is a standard feature at different temperature levels based on their respective manufacturer specifications. National Fire Protection Association (NFPA) 1801, Standard on Thermal Imagers for the Fire Service–2021 Edition, stipulates that only the colors of yellow, orange, and red can be used. For example, this manufacturer inserts colorization at this temperature range: Yellow 500-800°F (260-426°C), Orange 800-1,000°F (426-537°C), Red 1,000+°F (537°+C).
What the NFPA does not stipulate is what temperature this colorization should appear. Therefore, all manufacturer specifications can vary, so make sure you understand this before use.
- What Am I Looking At? (August 2022)
- Thermal Imaging and Image Interpretation
- New Changes to NFPA Thermal Imaging Technology
- Handheld Thermal Imaging Cameras Continue To Be Popular Among Fire Departments
- Thermal Imaging: Thermal Imagers Not Just for the Crews
- Thermal Imaging: Understanding Your TI Technology
- Where Can’t I Use a Thermal Imaging Camera
- The Outdoor Effects Emissivity Has on Thermal Imaging
- Using Thermal Imaging During Water Rescue
- Let’s Talk Thermal Imaging
What does colorization do for you?
As the temperature progresses within the structure, your TI will produce colorization indicating concerns: extreme ceiling temperatures, advancing fire progression, the location of the fire, and so on. Each color palette will give you a certain temperature range. Remember, this colorization is only temporary, because as soon as you get water on the fire, the red goes away, and your TI is back to showing grayscale imagery. Some TI technology have user selectable modes, which insert distinct color palettes based on various applications you require, so make sure you understand which application your TI should be set on.
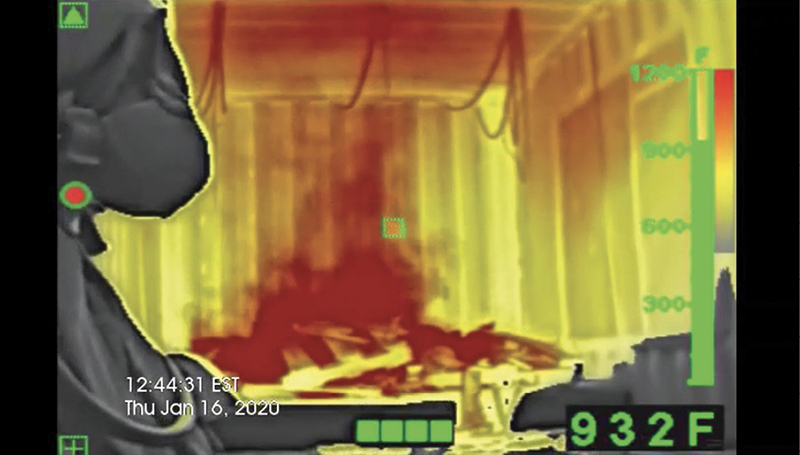
1 Colorization, temperature sensing indicators, and heat color reference bar. (Photos courtesy of Bullard.)
To better understand the colorization and temperature range that you are in, your TI (depending on its make, model, and age) will have a “heat color reference bar” located vertically on the right side of the TI display. This is integrated with the sliding bar scale temperature sensing indicator. Again, the colors of yellow, orange, and red will correspond with the temperature as it depicts changes.
What does temperature measurement do for you?
Temperature measurement is another standard feature in all TIs. The temperature that your TI registers is taken from the “temperature measurement zone,” based on either the square box or crosshairs in the center of the display screen. If your TI is NFPA 1801 compliant, it will have a digital number that will only appear when the TI is put into TI basic plus mode. What will always be visible on the right side of your display will be a sliding bar scale for temperature measurement or temperature sensing indicator. If you have an older TI or one that is not NFPA compliant, chances are you may have both temperature sensing indicators in your display screen.
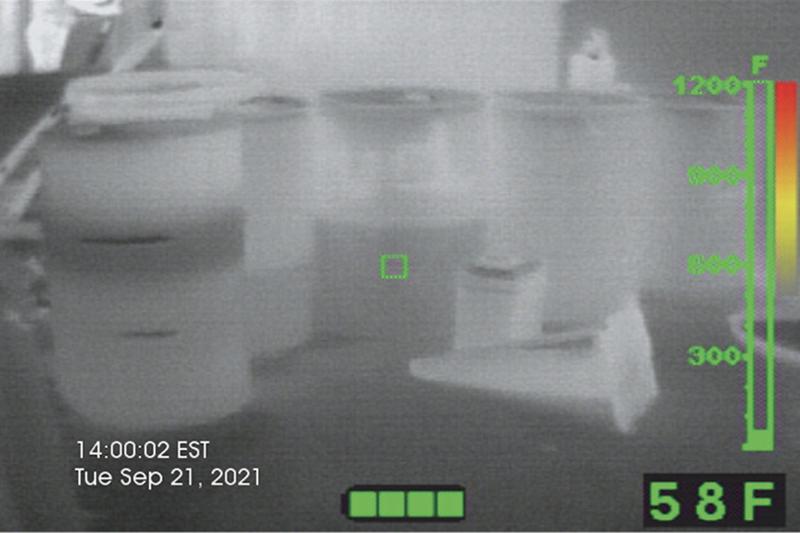
2 Liquid level and temperature of 45-gallon chemical drums.
The temperature your TI is measuring is a relative surface temperature and cannot detect with 100% accuracy. It is a myth that your TI can detect air temperature or gases. TIs use the distance-to-spot (DTS) ratio, which is the size of the area or “spot” being measured as it relates to the distance of the thermometer from the spot. For example, this manufacturer has a ratio of 57:1—1 foot × 1 foot at 57 feet (30 cm × 30 cm at 17 m). The lesser the DTS, the closer you must be with your TI and vice versa.
So, why are TIs not accurate for temperature measurement? Many factors can affect this, starting with the angle of view, which is one the biggest issues I have experienced. Looking at an object head on will only give you that one side you are looking at. Walk around the object (if you can) and look at it from all sides, giving you different “angles of view” and probability of a change in temperatures. Any rounded or glossy surfaces will also not register proper temperature measurement either because of geometry or reflected energy.
Other factors that will influence temperature measurement are emissivity; atmospheric attenuation, which includes particulate, humidity, and water particulate; and atmospheric augmentation, which includes temperature and wind velocity. Using the temperature measurement in your TI does help you in applications such as size up—areas of concern; overhaul—to ensure total extinguishment and prevention of rekindle; hazardous materials; smells and bells; and overheated ballasts and electrical equipment.
The more experience and understanding of thermal imaging you have, the more you can benefit from the information your TI will provide. Colorization and temperature measurement are there to give you only certain information, but that changes constantly. What does not change and will always be a visible constant is the grayscale imagery.
Manfred Kihn is a 19-year veteran of the fire service, having served as an ambulance officer, emergency services specialist, firefighter, captain, and fire chief. He has been a member of Bullard’s Emergency Responder team since 2005 and is the company’s fire training specialist for thermal imaging technology. He is certified through the Law Enforcement Thermographers’ Association (LETA) as a thermal imaging instructor and is a recipient of the Ontario Medal for Firefighters Bravery. If you have questions about thermal imaging, you can e-mail him at manfred_kihn@bullard.com.

